How to use this tool
Requirements
The visualization was designed for modern Firefox, Chrome and Edge browsers. We recommend to use one of these if available. The tool requires JavaScript to be enabled. The site does not require cookies, or any kind of account to be created, and there is no form of user-tracking used.
The visualization relies on loading the separate data sources and map background imagery. Spending a few minutes using the tool will probably require around 10 MB of data to be downloaded, depending on many different area you look it. This should decrease as you use the tool more and the data is saved inside your browser.
Exploring the data
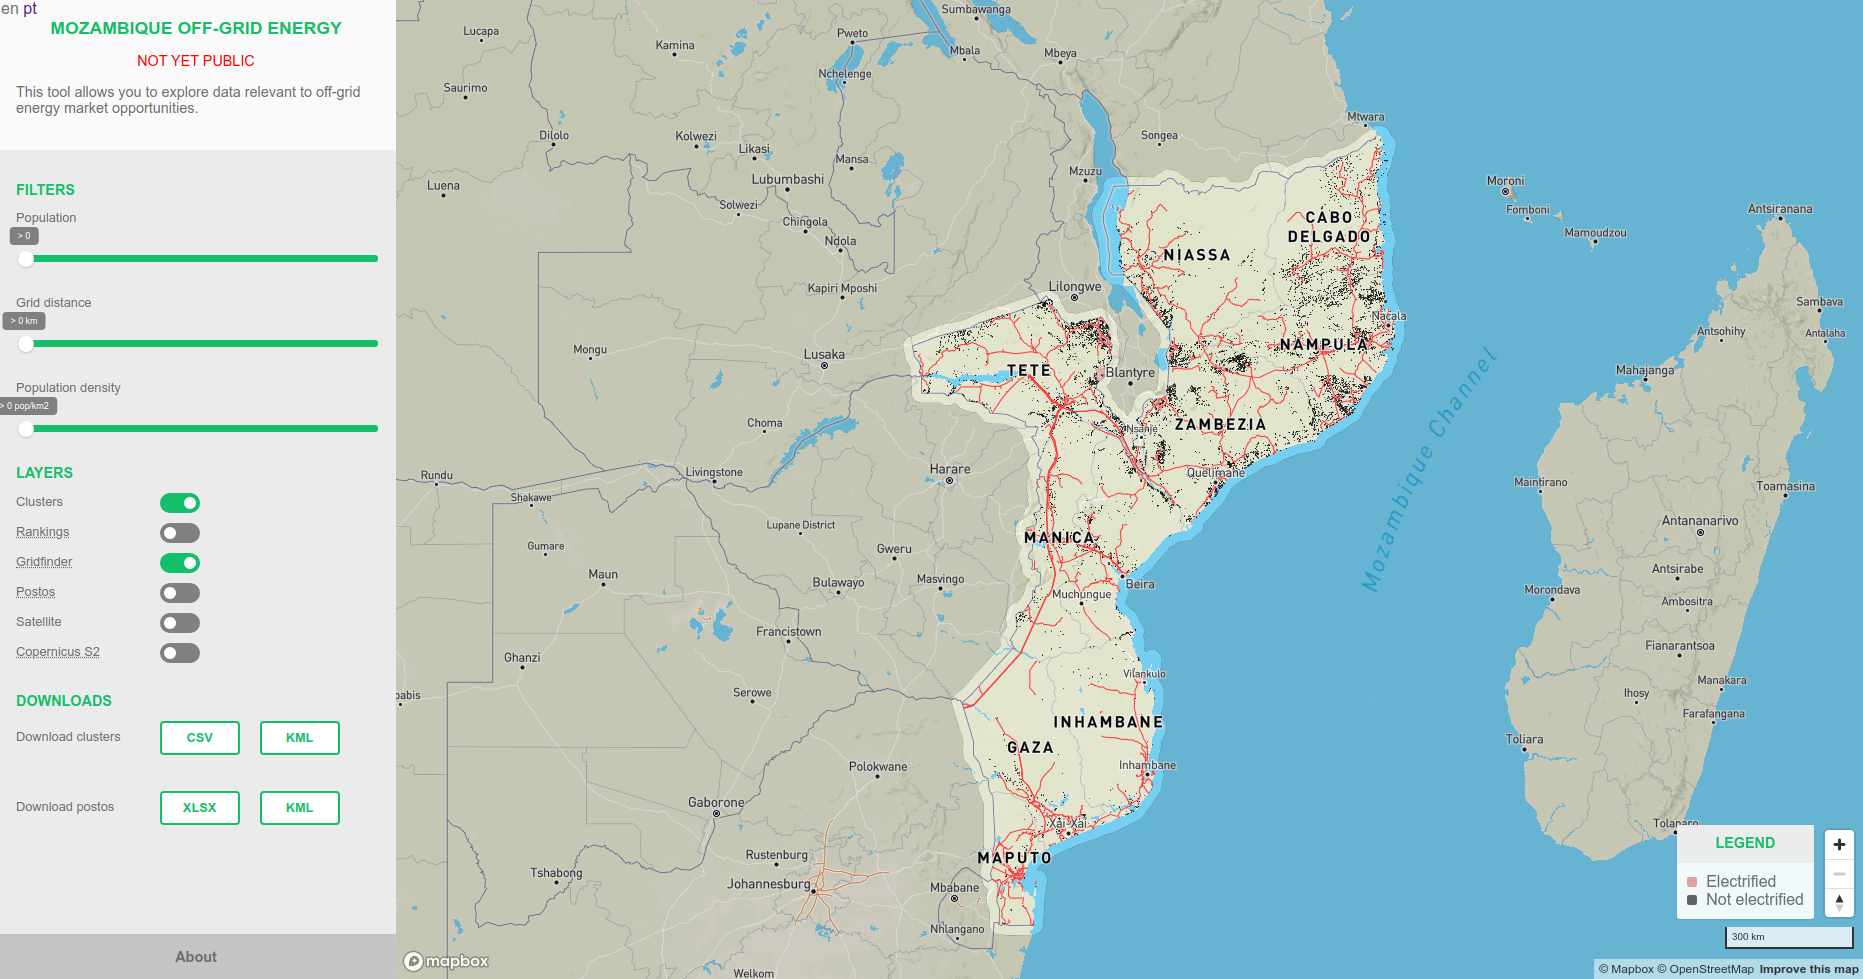
When you load the tool, you will be greeted with a screen similar to the one below. The filters, controls and download links are in the left panel, while the map and all data are displayed in the main area on the right. You can move around the map by clicking and dragging (or using the arrow keys) and you can zoom in and out by scrolling, or using the + and - buttons in the bottom right.
Note: wherever you see text that is dotted-underlined, you can hover on it to get a small help box!
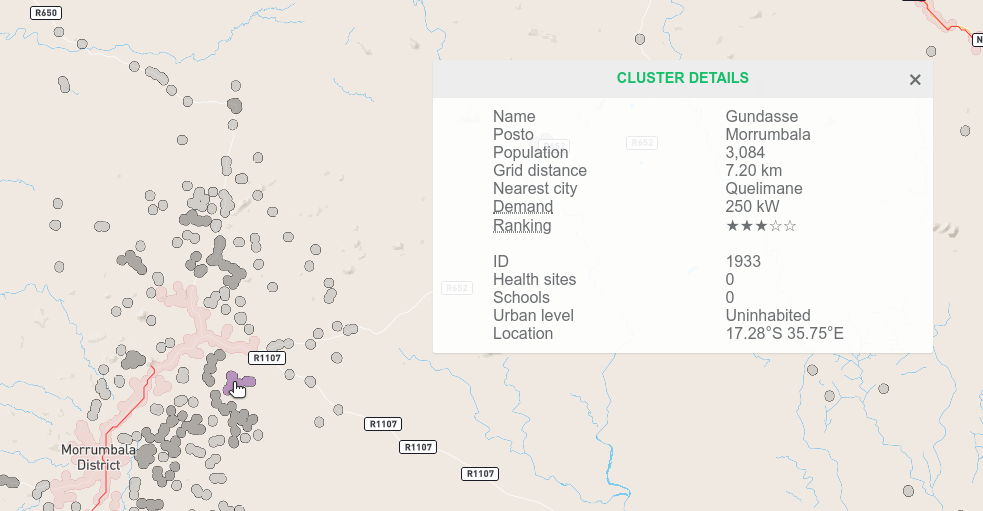
If you zoom in, you will see much more detail about the location and size of each cluster. You can click on an individual cluster (highlighted in purple below) and a pop-up in the top-right of the screen will display a summary of information about that cluster. Note that the full list of data from above is excluded, but can be access if you download the cluster files!
Filters and layers
The filters can be used to control which clusters are displayed, based on population, grid distance, and population density. Please see the video below for an example!
The "Layers" section has toggles that enable and disable certain layers. You can experiment with these to see how they work!
Summary
Project summary
This project was developed to support the off-grid energy sector in Mozambique. It is also a showcase of the value that open data, satellite imagery, and modern geospatial techniques can bring to development.
The project consists of two core components:
-
Data: Combining official government data with openly shared data (such as population, urban level) and raw satellite imagery, to create a database of "settlements", ranging from 50 to 100,000 people, with attached information about each, from number of households, to estimated electricity demand and pollution levels.
-
Visualization: Bringing together the above data, together with some simple filtering and controls and a modern web-map interface, to allow all users to access and investigate the data. This also serves as an entry-point to the project, and allows users to download all data for analysis in GIS or spreadsheet software.
Both of these are designed to be useful to a wide variety of people: government decision-makers and experts, off-grid companies and their staff, along with the local and international communities of stakeholders and citizens.
All processes used in creating this data and visualization are openly licensed and shared, so that others may benefit from them. They live on GitHub, in moz-offgrid-data and moz-offgrid-viz . The sources for all raw input files are linked, along with their various licenses.
If you have questions, comments, or suggestions about this project, please get in touch .
Methodology
Data sources
The full list of data sources used in this project is shown in the table below. Note that any changes will first be made in the GitHub repository , so please look there for the most up-to-date list. Wherever possible, the respective licenses are shown for each dataset. Please let the team know if any links, names or licenses are incorrect.
| Type | Source | License |
|---|---|---|
| Population | Facebook HRSL | Creative Commons Attribution International |
| Population | Worldpop | Creative Commons Attribution 4.0 International |
| Population | GHS-POP | Creative Commons Attribution 4.0 International |
| Urban degree | GHS-SMOD | Creative Commons Attribution 4.0 International |
| Grid | gridfinder | Creative Commons Attribution 4.0 International |
| Grid | Transmission network | Creative Commons Attribution 4.0 |
| Spatial electricity access | GDESSA | CC BY 4.0 |
| Electricity statistics | EDM Master Plan 2018 | |
| Distance to cities | JRC Global Accessibility Map | Not specified - but most EU data is CC BY 4.0 |
| GDP | UNEP/DEWA/GRID-Geneva GDP 2010 | UN license, Free for non-commercial |
| Admin boundaries | GADM | Free for non-commercial use, noredistribution |
| Admin boundaries | Natural Earth Admin 0 | Public domain |
| Compilation | USAID RtM | General USAID DEC license, Creative Commons Attribution-No Derivatives 4.0 International License |
| Night time lights | NOAA VIIRS | No copyright |
| NDVI | Sentinel-2 | Copernicus Sentinel Data Terms and Conditions (attribution) |
| NO2 emissions | Sentinel-5P | Copernicus Sentinel Data Terms and Conditions (attribution) |
| Hydropower resources | African Small Hydro Potential | Creative Commons Attribution 4.0 |
| OpenStreetMap | OpenStreetMap | Open Data Commons Open Database License |
| OpenStreetMap | HOT Feature Exports | Open Database License (ODC-ODbL) |
| Settlements | UN IOM Mozambique settlements | Non-commercial, no redistribute |
| Settlements | OCHA Main Cities | Creative Commons Attribution International |
| Health | OCHA Health Facilities | Public domain |
| Energy | OCHA Energy Facilities | Creative Commons Attribution International |
| Rivers | OCHA Stream Network | Creative Commons Attribution International |
| Poverty | OPHI Poverty Rate | Creative Commons Attribution International |
| Affordability | USAID Power Africa surveys | |
| Admin boundaries | OCHA Admin Boundaries | humanitarian use only |
Clustering
In order to make this data easier to interpret for different users, the data above are processed to create individual "clusters" for each settlement. That is, a cluster of houses and buildings that represent a single village or town. As this process is automated, these do not always match up perfectly with existing names and boundaries. This is an ongoing process, and feedback is welcome on how to improve the data!
The starting point for the clusters is the High Resolution Settlement Layer , created by Facebook. This provides high resolution information on population in a raster format: a uniform grid of cells where each cell is 30 metres wide. To convert this into vector format (i.e., polygons and shapes for each settlement), the algorithm finds neighbouring populated cells, and merges these together. Some other operations are then performed to remove clusters that are too small or large, or join clusters where necessary.
Once these bare clusters are prepared, we can any and all of the above datasets to them as attributes. Grid data is used to calculate the distance from each cluster to the grid. GDP data is used to calculate the GDP/capita in each cluster. Population, schools and health facilities are used to estimate energy demand. The table below shows all attributes that have already been added to the clusters.
As better data becomes available, we can improve on these attributes and add new ones!
| Attribute | Name | Unit | Source |
|---|---|---|---|
| Province | adm1 | OCHA | |
| Province code | adm1_code | OCHA | |
| District | adm2 | OCHA | |
| District code | adm2_code | OCHA | |
| Posto | adm3 | OCHA | |
| Posto code | adm3_code | OCHA | |
| Settlement | name | IOM Settlements | |
| Latitude | lat | deg | |
| Longitude | lon | deg | |
| Area | area | km2 | |
| Population | pop | HRSL | |
| Households | hh | HRSL | |
| Population density | popd | pop/km2 | HRSL |
| Urban type | urban | GHSL SMOD | |
| Nearest city | city | OCHA Main Cities | |
| Nearest city distance | cityd | km | OCHA Main Cities |
| Travel time to city | travel | hours | JRC |
| Health facilities | health | OCHA | |
| Schools | schools | OSM | |
| Grid distance | grid | km | gridfinder/OSM |
| Electricity access | elec | gridfinder/OSM | |
| Agricultural indicator | agri | NDVI | |
| Growth | growth | ML with S2 image | |
| Emissions | emissions | NO2 | |
| NTL | ntl | VIIRS | |
| GDP | gdp | USD/cap | UNEP |
| Poverty rate | poverty | ||
| Markets | markets | ||
| Telecom towers | telecom | ||
| Electricity access | prov_elec | USAID | |
| Poverty rate | prov_pov | OPHI | |
| Demand | demand | kW |
The full process is outlined in the repository , including exact instructions and scripts needed to arrive at the final clusters files.
In addition to these clusters, the more important data are also aggregated to province, district and posto levels.
The final data is available to download from the visualization platform, but can also be downloaded directly here:
- Clusters: download CSV or download KML
- Postos: download XLSX or download KML
Programmes of the Energy Cluster
Energising Development
Energising Development (EnDev) is global programme financed by Germany, the Netherlands, Norway, and Switzerland. EnDev works in more than 20 countries across Africa, Asia and Latin America. EnDev supports national governments to create an environment that enables supply and demand of sustainable energy – to the last mile. Because achieving universal access to energy requires profitable business models.
EnDev tackles energy poverty with a market-based approach putting the focus on consumers’ needs. Since 2006, EnDev has provided sustainable energy access to more than one million people in Mozambique through grid densification, village mini-grids based on hydropower plants, solar lanterns, solar home systems and improved cookstoves. EnDev supported the establishment of a results-based financing fund: FASER (Fondo de Acesso sustentável as energias renováveis em Moçambique, Fund for Sustainable Access to Renewable Energies and Efficient Technologies) was launched in July 2019. Since then, the open basket fund grew in terms of funding: GBE joined in 2020 and the EU decided to scale-up the CovidPlus incentive in 2021.
In the area of grid densification, EnDev Mozambique is working with the national state-owned electricity utility EdM to provide access to the electricity grid for disadvantaged households. More information is available online: Energising Change - EnDev .
Implemented by:
Green People's Energy
The initiative Green People’s Energy for Africa (GBE) aims to improve the conditions for decentralised energy supply in selected sub-Saharan African countries with the participation of citizens and companies. In Mozambique, GBE focusses on promoting the productive use of decentralised renewable energies and the electrification of social institutions. The aim above all is economic development by increasing local value chains and employment.
By advising local businesses and promoting local training centers, local people are empowered to take development into their own hands. With offering training opportunities, the programme intents to capacitate the employees of the current and potential companies in the markets for solar home systems and improved cookstoves. GBE Mozambique also supports capacity building in the public sector. By advising state actors on rural electrification planning, investment security for private actors is improved to enable more efficient and faster electrification of rural areas in Mozambique. More information is available online: Green People’s Energy for Africa .
Implemented by:
GET.invest
GET.invest is a European programme that mobilises investment in renewable energy, supported by the European Union, Germany, Sweden, the Netherlands and Austria. Since 2019, the programme has been operating a country window in Mozambique funded by the European Union and Germany, implemented by the Deutsche Gesellschaft für Internationale Zusammenarbeit (GIZ).
GET.invest Mozambique is part of PROMOVE ENERGIA – a comprehensive strategy between the EU and the Government of Mozambique to provide households and businesses in rural areas with access to sustainable and affordable energy. More information is available online at GET.invest .
Implemented by: